Phuket Business: Food and energy inflation soaring

PHUKET: Once again, raw data from the Commerce Ministry has affirmed that the South, and particularly Phuket, continues to be “hotter” – in terms of the cost of living – than elsewhere in the Kingdom.
The Phuket Commerce Office, in conjunction with the Commerce Ministry’s Bureau of Trade and Economic Indices, recently published the Provincial Consumer Price Index (CPI-P) for September.
The report compared the cost of living in September 2012 with the previous month (m-o-m), and with September of last year (y-o-y). It also compared the first nine months of the year with the same period in 2011.
Thailand’s overall CPI study surveyed 417 consumer categories, but the CPI-P for Phuket looked at only 256, covering everything from food and beverages, apparel, shoes and day-to-day necessities, to medical and personal care services, vehicles, transport, communications, entertainment, education and religion.
Using 2007 as a base year (100 points) Thailand’s overall CPI average peaked at 116.67 points in September, compared to 116.28 points in August, equating to a m-o-m rise of 0.84%. The y-o-y inflation rate was 3.38% and the Commerce Ministry has projected the full-year figure to be between 3 and 3.4%.
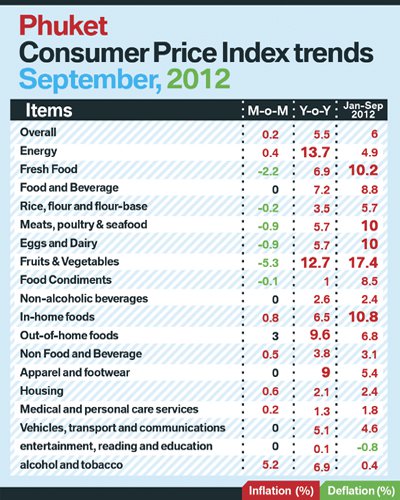
Phuket’s CPI-P average peaked at 127.1 points in September, compared to 126.8 points in the previous month, a m-o-m increase of 0.2% and y-o-y rise of 5.5%. For the first nine months of the year, inflation was at 6% y-o-y – more than twice the national average.
According to the study, food and beverage items, on average, did not rise (even though from July to August 2012, the category rose by 1.5%). However, certain sub-categories did.
Namely, the price of fresh vegetables (cucumbers, Chinese cabbage, kale, parsley, morning glory, mushrooms and lime) increased by 2.3%, which the report attributed to heavy rains affecting crop supplies. In-home foods rose by 0.8%, and out-of-home foods (noodles, rice and curry at eateries and stalls) by 3%.
Meanwhile, the price of rice, flour and flour-based foods dropped by 0.2%; meats, poultry and seafood, eggs and milk products by 0.9%; fresh fruits (oranges) by 8.3% and food condiments, which includes seasonings and sauces, by 0.1%.
Prices of non-food and beverage items surveyed rose by 0.5%, compared to the previous month’s rise of 0.4%. This change was attributed mostly to the rise in tobacco and alcoholic product prices, which jumped 5.2% due to an increase in respective duties which took effect in August.
Housing utilities (electricity and water) rose in the month by 0.6%, attributed to an increase in the Fuel tariff (Ft) of the Energy Regulatory Commission.
The new Ft, effective from September to December, is 48 satang per unit, up 30 satang from the previous Ft of 18 satang. Meanwhile, medical and personal care services, which includes the cost of pharmaceuticals, nudged up by 0.2%. Fuel fell by 0.9%.
Compared to September 2011, Phuket’s cost of living rose 5.5%, with food and beverage jumping by 7.2% and fruits and vegetables by 12.7%. Out-of-home foods rose by 9.6% and in-home foods by 6.5%. Meats, poultry and seafood rose by 5.7% and rice, flour and flour-base foods by 3.5%. Non-alcoholic beverages rose by 2.6%, egg and dairy products by 1.7% and food condiments up by 1%.
As for non-food-and-beverage items, average inflation was 3.8%, which came from a 9% rise in apparel and shoes; 6.9% jump in alcohol and tobacco products; 5% hike in vehicles, transport and communications – a category which includes fuel, public transport fares and automobile prices; a 2.1% rise in housing, and a 1.3% increase in the cost of medical and personal care services.
When comparing the first nine months of this year with the same period last year, inflation was 6%, attributed to a 8.8% rise in food and beverages, calculated from the following increases: fruits and vegetables (17.4%); in-home foods (10.8%); meats, poultry and seafood (10%); food condiments (8.5%); out-of-home foods (6.8%); rice, flour and flour-based foods (5.7%); eggs and dairy products (2.8%) and non-alcoholic drinks (2.4%).
As for other non-food, non-beverage items, inflation averaged 2.1%, which came from price rises in apparel (5.4% ), vehicles, transport and communications (4.6%); housing (2.4%); medical and personal care services (1.8%) and alcohol and tobacco products (0.4%).
Meanwhile, prices of products and services related to entertainment, reading, education and religion declined on average of 0.8%
— Steven Layne
Latest Thailand News
Follow The Thaiger on Google News:


