Phuket Business: Island’s inflation skyrockets
PHUKET: Not only does Phuket continue its reign as the most expensive (consumer) province in Thailand, but the island province’s rate of inflation doubles that of the national average, recent economic data shows.
The Phuket Commerce Office, in collaboration with the Phuket provincial government and the Commerce Ministry’s Information Office and Bureau of Trade and Economic Indices, recently published the province’s Consumer Price Index (CPI-P) report for October 2012.
The CPI-P monthly report for Phuket surveys 256 consumer goods and services – covering everything from food, beverages, apparel, housing and personal healthcare to vehicles, transport, communications, entertainment, media, education, religion, tobacco and alcohol.
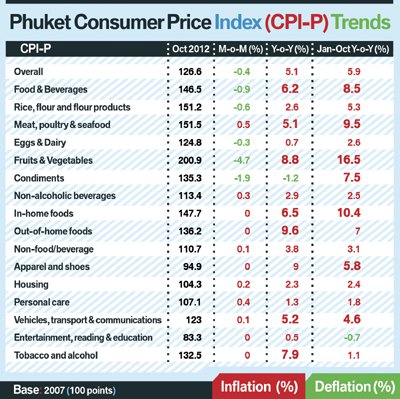
Comparing current prices with those of 2007 as a base year (100 points), Phuket’s CPI-P rose to 126.6 points last month.
In other words, the overall cost of living on the island has jumped by 26.6% over the last five years, which translates to an average inflation rate of 5.3% per annum.
This is compared to the national 5-year inflation rate average of 16.8% or 3.3% per annum.
Though Phuket prices continue to surge relentlessly, there was some minor relief in the short run, with last month’s CPI-P declining month-on-month (m-o-m) from September by 0.4 percentage points.


However, the CPI-P last month still jumped by 5.1 percentage points year-on-year (y-o-y) from October, 2011. Furthermore, when comparing the first ten months of 2012 with the same period in 2011, the CPI-P rise was even higher, peaking by 5.9 percentage points, y-o-y.
This equates to nearly double the national inflation rate over the same period, which stood at 2.9%.
Oct vs Sep – M-o-M
The 0.4% m-o-m drop in the CPI-P was a result of the overall price for food and beverage items falling by 0.9%, at the same time that non-food/beverage items rose by only 0.1% on average.
The report notes that the price drop for food and beverage items from September to October comes in light of prices remaining steady during the previous month comparison period (August to September).
The drop was calculated from price reductions measured in select categories as follows: rice (-0.6%); pork ribs (-1.2%); raw and grilled chicken (-2.5%) and chicken eggs (-0.3%).
Such price reductions were attributed to the fact that supply had outstripped demand for these items leading up to and during the vegetarian festival.
Meanwhile, the price of tangerines dropped by 11.6%, while food condiments such as fish sauce fell by 1.9%.
At the same time, the items that jumped in price included flour and tofu (0.3%); various types of seafood including silver pomfret fish, squid, cockles, sea crabs and salted mackerel and tuna, which rose by 2% on average, and likewise fresh vegetables and fruits, including kale, cucumbers, morning glory, coriander, onion, cabbage, chili, peanuts, pineapples, rambutan, mango and watermelon, jumping by an average 12.9%.
Such inflation was attributed not only to demand outstripping supply as a result of the Veg Fest, but also to the fact that nationwide crop supplies had been adversely affected by heavy rainfall this year.
Non-food/beverage items rose on average by 0.1% (compared to the previous m-o-m comparison period, when the category experienced a rise of 0.5%) with rises as follows: barber and salon services (0.4%); housing related costs such as utilities, construction materials, cement, bricks and painter fees (0.2%); transport, vehicles and communications (0.1%); and petrol (0.3%).
Oct 2012 vs 2011 – M-o-M
The 5.1% jump was calculated from the following: a 6.2% jump in food and beverage consumer items, which included out-of-home foods (9.6%); fruits and vegetables (8.8%); in-home foods (6.5%); meat, poultry and seafood (5%); non-alcoholic beverages (2.9%); flour and flour products (2.6%); eggs and dairy products (0.7%); while food confinements dropped over the same period by 1.2%.
Non-food/beverage items rose on average by 3.8%, which came from price rises in apparel and shoes (9%) tobacco and alcohol products (7.9%); vehicles, public transport and petrol (5.2%); housing (2.3%); personal health care and pharmaceuticals (1.3%).
Jan to Oct – Y-o-Y
Phuket’s inflation rate peaked at 5.9% when comparing the first 10 months of this year with the same period last year. This was calculated from an 8.5% rise in food and beverage consumer items, which included fruits and vegetables (16.5%); in-home foods (10.4%); meat, poultry and seafood (9.5%); condiments (7.5%); out-of-home foods (7%); rice, flour and flour products (5.3%); eggs and dairy products (02.6%) and non-alcoholic beverages (2.5%).
Non-food/beverage items rose on average by 3.1%, which came from price rises in apparel and shoes (5.8%); vehicles, public transport and petrol (4.6%); housing (2.4%); personal health care and pharmaceuticals (1.8%) and tobacco and alcohol products (1.1%).
Meanwhile, products and services classified as entertainment, reading, education and religion, dropped by 0.7%.
— Steven Layne
Latest Thailand News


Follow The Thaiger on Google News: