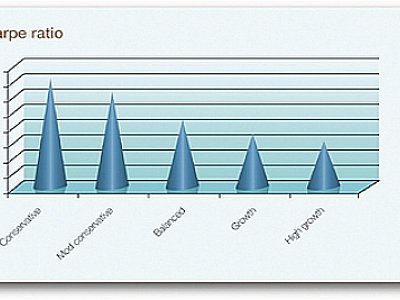
Phuket Business: Calculating the Sharpe ratio

PHUKET: One statistic you will often see when looking at a fund’s performance is the “Sharpe ratio”.
This is an attempt to quantify the excess return for a given level of risk. For example, two funds may both return 12%. If one returns a steady 1% every month while the other swings up and down, common sense and our blood pressure readings both tell us the first fund is better.
But it gets tricky if one fund returns 9% and another returns 13% with a higher level of volatility. The Sharpe ratio is an attempt to quantitatively compare which one gives “more bang for your buck” in terms of stomaching risk.
To quickly estimate a Sharpe ratio, subtract a benchmark “risk free” long term average rate, such as what a government bond pays; let’s assume 3.5%, (even though that seems like a dream in today’s markets). Take the return of the investment you are looking at and divide by its annual volatility.
So, a fund such as Axiom, to give an extreme positive example, returns about 12%. Subtract from this the 3.5% risk free yield to get an excess return of 8.5%. Then, divide this by the fund’s annual volatility of 1% to get an amazing Sharpe ratio of about 8.5.
As a guide post, one could substitute in the longer term return of the S&P 500 as 10%. Assume the risk-free return is 1%, and the average standard deviation of the S&P 500 is about 16%. Doing the math, we find that the average, long-term Sharpe Ratio of the US market is about 0.4 = ((10%-3.5%)/16%).
The Sharpe ratio of the Winton trend following fund, which is a very consistent market-based fund, is about 8. This fund essentially gives twice the return per unit of risk when compared to a diversified US stock market investment.
The main problems involved with the Sharpe ratio are that it is backwards-looking and ignores the negative effects of highly-correlated negative returns, or very large future negative returns, which are terms for the total failure of a fund.
If a strategy produces great results, right up until a rare event causes a blow-up, such as the famous Long Term Capital Management crisis caused by the Russian default, the Sharpe ratio will look great beforehand and have no predictive value to help avoid the enormous loss about to be suffered.
One needs to look at the entire picture when considering investments, and in my opinion the Sharpe ratio is an excellent “relative” tool. This means it helps look at how funds have performed in the past, relative to each other, but it does not help predict if a fund will get into trouble in the future.
This is an extremely important distinction that you must never forget. You always need to consider as many possible future scenarios as you can, no matter how unlikely, and try to determine how the funds in your portfolio would be affected by these scenarios.
Nobody has a crystal ball, but if you understand what situations might negatively affect a fund you hold, then you can be on the lookout and get out if there are any signs of trouble.
David Mayes MBA lives in Phuket and provides wealth management services to expats around the globe, focusing on UK pension transfers. He can be reached at
085-335 8573 or david.m@faramond.com.
— David Mayes
Latest Thailand News
Follow The Thaiger on Google News:


